NepTune
Code Repository
You can view the submitted presentation here.
Technique Overview
- Python
- PyTorch (CNN)
- sklearn (LGBM, XGBoost, KNN, K-means)
- pandas
- geopandas
- hyperopt
- shap
- matplotlib
- Spatial Modelling (Kriging)
Motivation
Progress toward the United Nations Sustainable Development Goals (SDGs) has been hindered by a lack of data on key environmental and socioeconomic indicators, which historically have come from ground surveys with sparse temporal and spatial coverage. Recent advances in machine learning have made it possible to utilize abundant, frequently-updated, and globally available data, such as from satellites or social media, to provide insights into progress toward SDGs.
Goal
The goal of this competition was to gain insight toward the SDG of clean water. The challenge was to estimate the water quality index of a given region using satellite images. The data will provide the water quality index of households, which is ranked on a 1-5 scale. Five is the “highest quality”, while one is the lowest.
This dataset and the motivation behind it is based on the work of SustainBench, where more details can be found 1.
The Model
Regression kriging is a spatial prediction technique that combines traditional regression modeling with interpolation of the regression residuals via kriging, otherwise known as geostatistical interpolation. This approach leverages auxiliary, explanatory variables to generate predictions while also accounting for each observation within a spatial field to better approximate target estimates. The overarching idea is to use current observations to estimate an unobserved point based on its proximity to known points. The theory is that you would expect water quality indices to exist within clusters together, as households should experience similar environmental conditions if they are close and become more disparate as you move further away. This effect is captured in measures of surface water runoff and irrigation, precipitation rates, air humidity and moisture, flooding effects and other climate trends.
The Pipeline
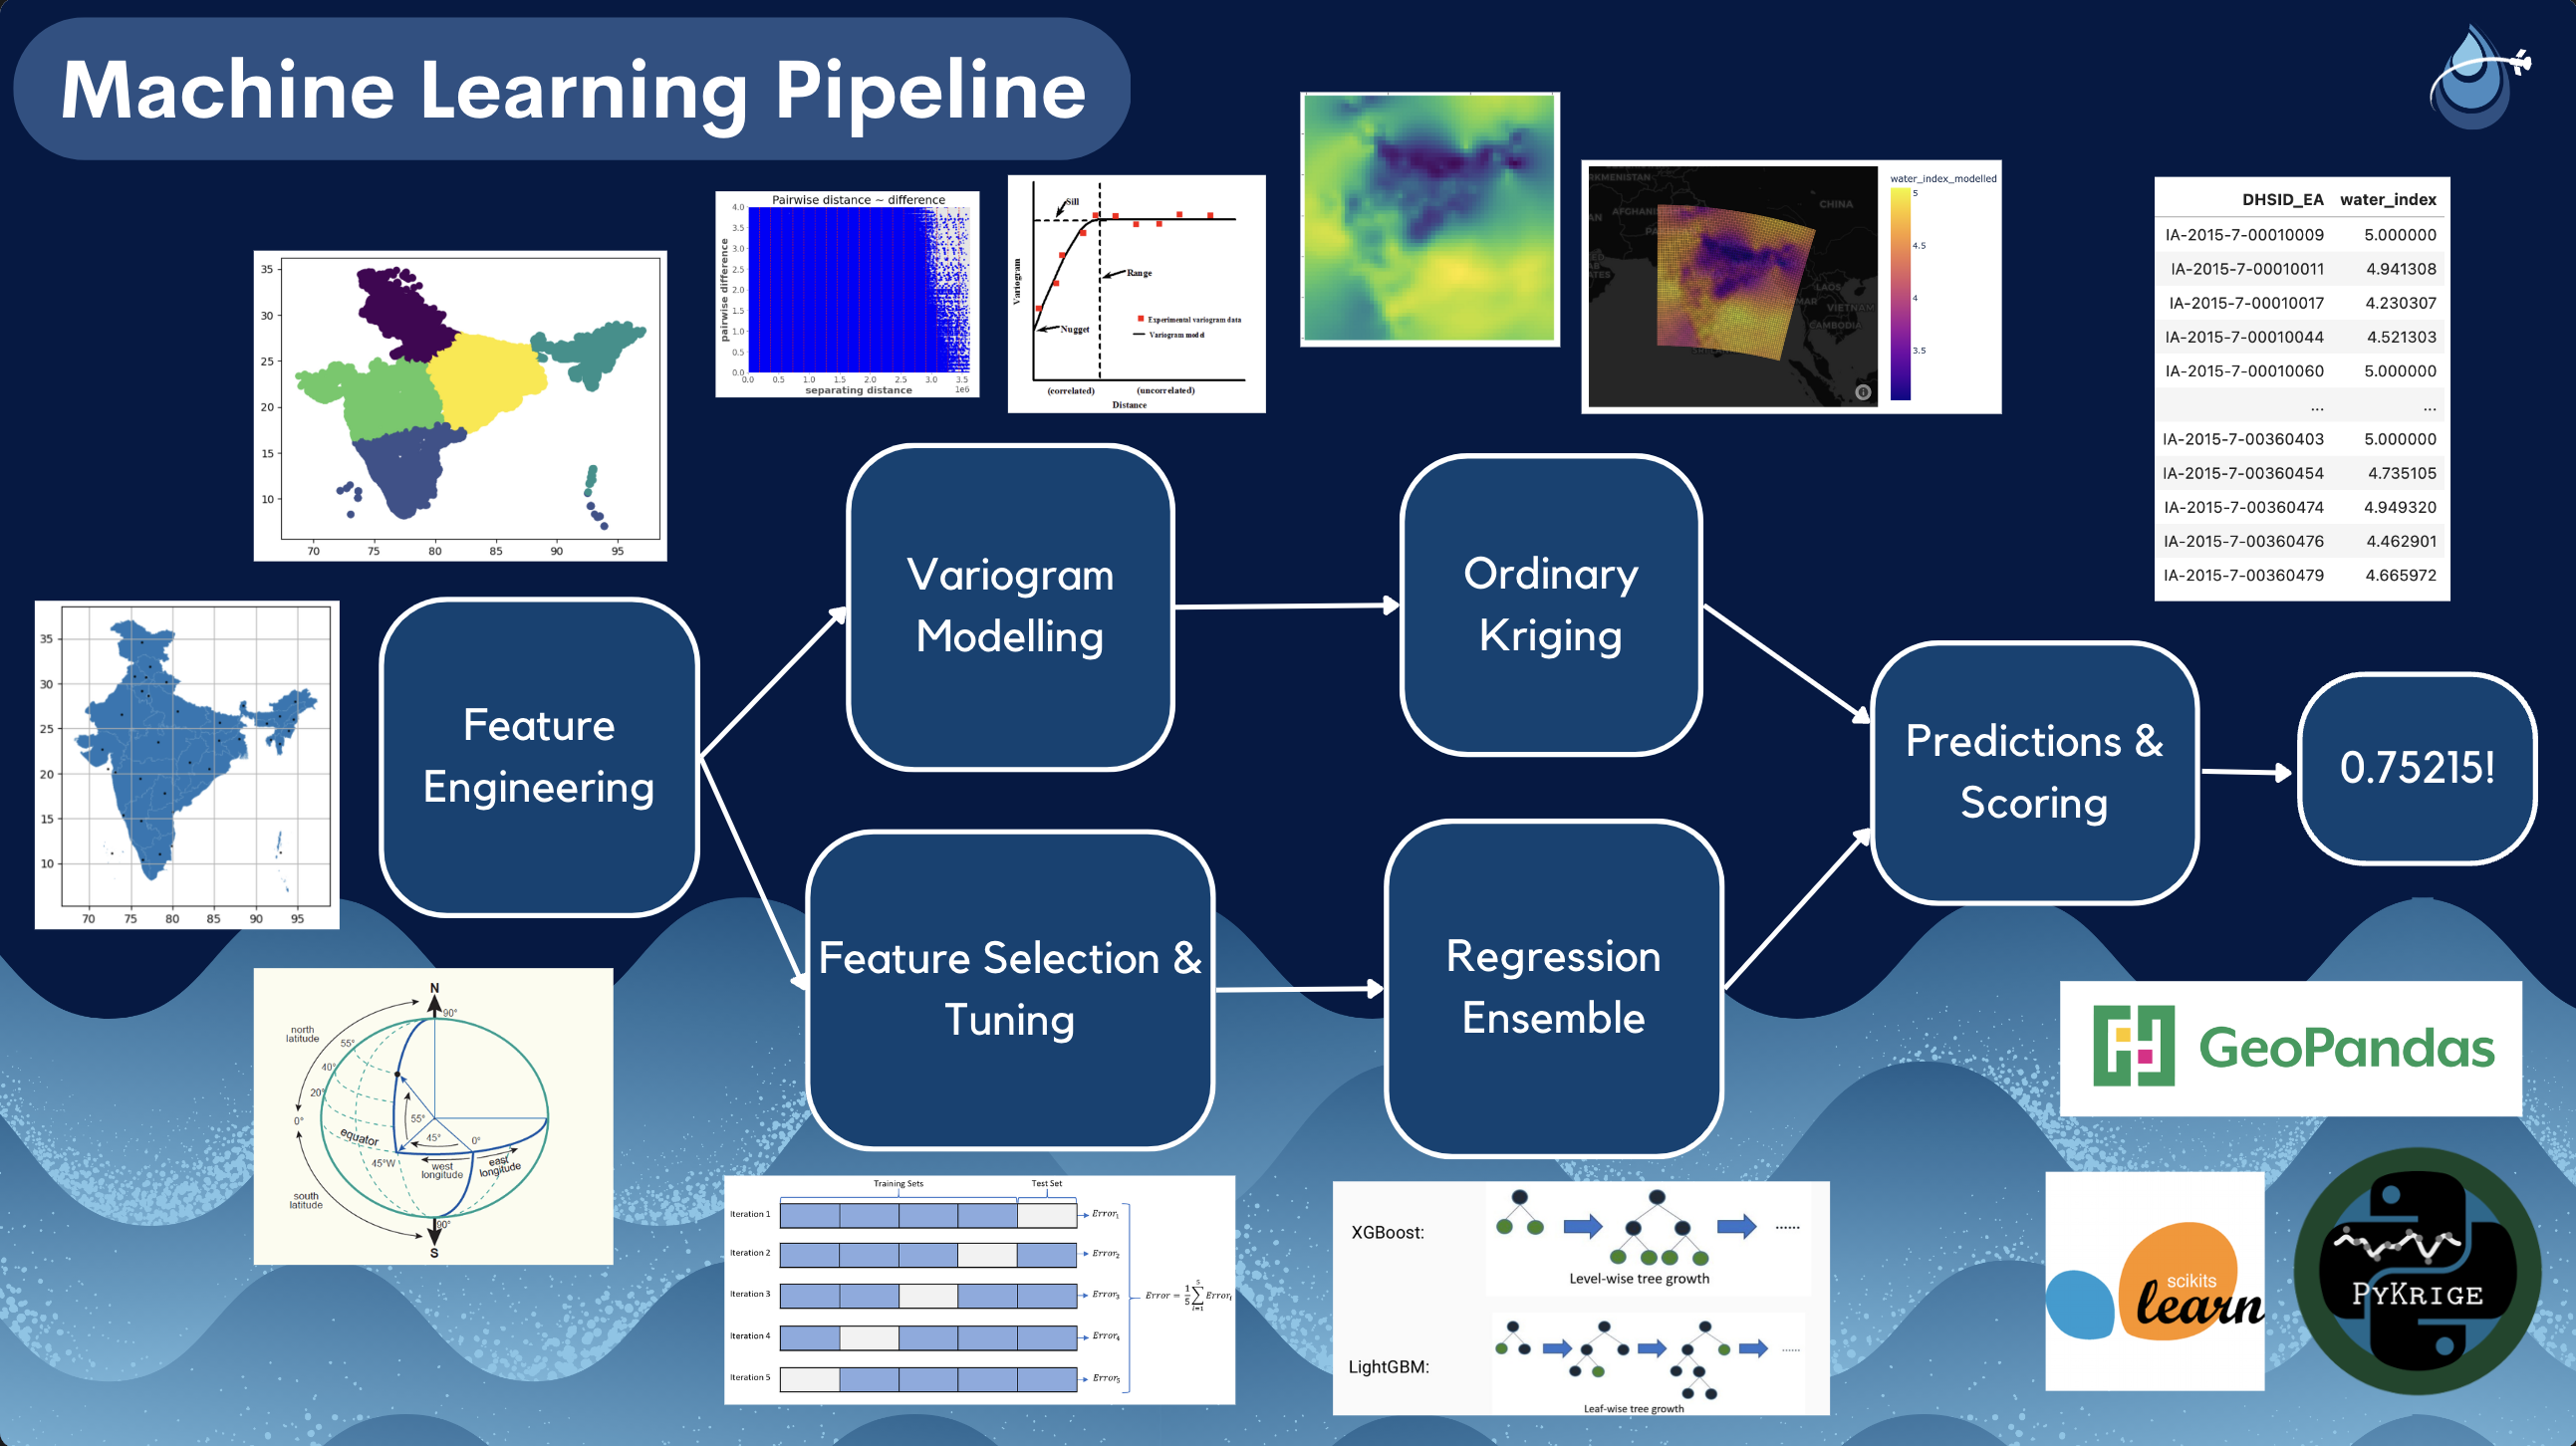
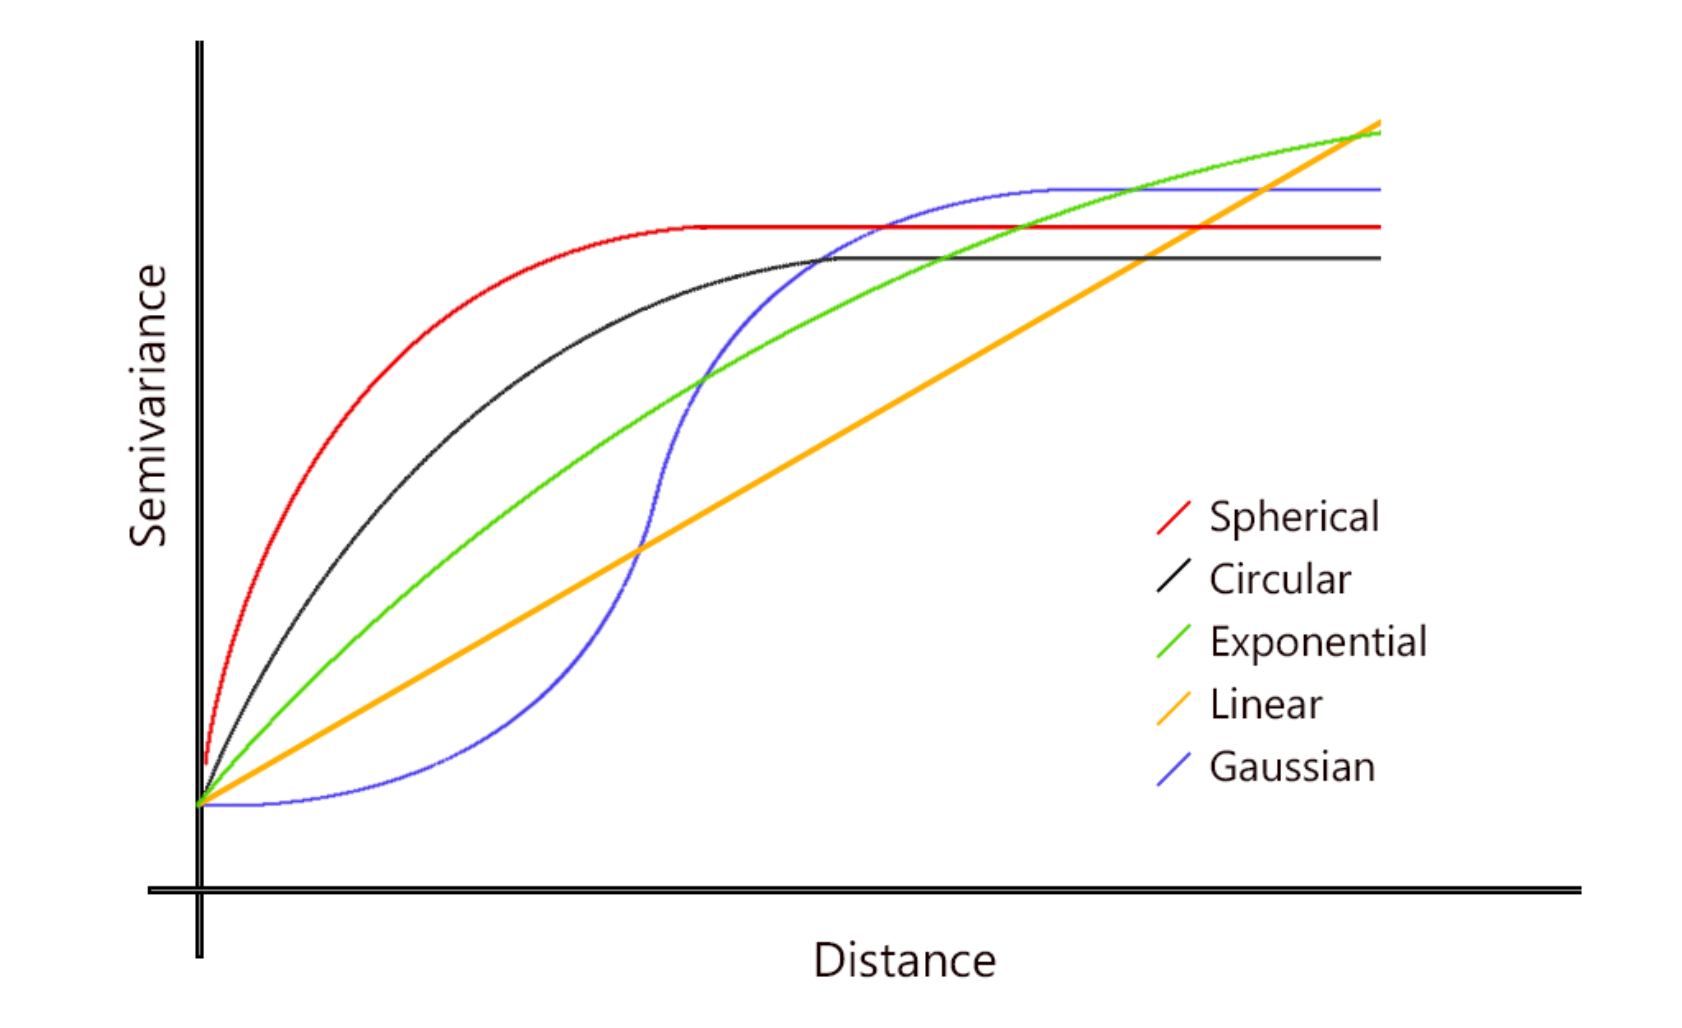
The pipeline uses ordinary kriging which is a type of probabilistic interpolation, where estimates are made using statistical models that include estimates of spatial autocorrelation (or the extent to which a data point is similar to other nearby data points). Variogram models allow us to capture this spatial autocorrelation, which is analogous to the autocorrelation function for time series data. I identify when points are no longer correlated by observing the lag at which the semivariance plateaus, indicating where the data is no longer trended, which allows me to identify the relationship that exists between points and utilize this information in the model.
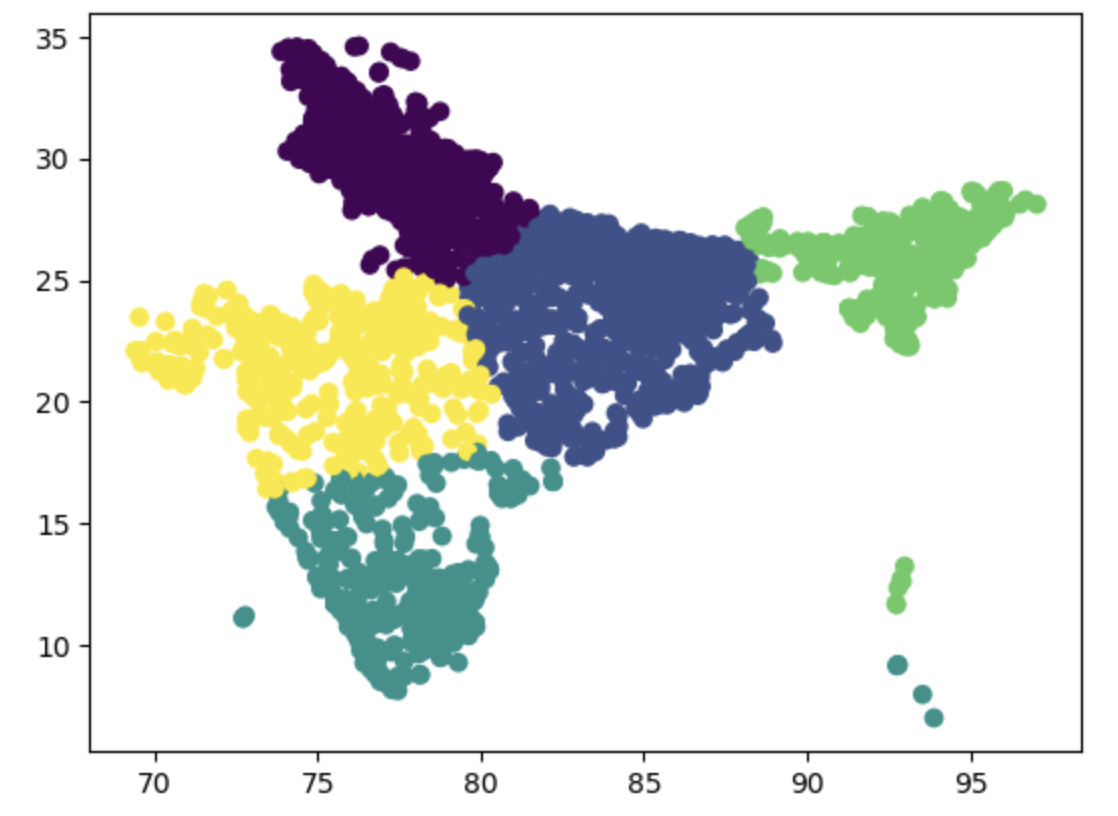
The first step in the pipeline involves feature engineering, where geospatial features such as polar and rotational cartesian coordinates are extracted from the latitude and longitude with aims to better capture the spatial relationships between data points This also involves creating labels for points naively using k-means clustering to group households into neighbouring regions, as well as identifying and computing the distance to nearest city centers.
Once this feature set is established, I perform two types of optimization where I determine what the appropriate variogram model will be for kriging and which features are relevant for the regression. The variogram uses a Matheron estimator to compute the similarities of observations at specific lags, which optimizes the settings for ordinary kriging. Auxiliary features are transformed using one-hot encoding and quantile transformers, and a recursive feature elimination method is used to drop extraneous metrics that are not found to be associated with the target using an intermediate Ridge regressor that applies cross-validation on subsets of the training data. Once both spatial and explanatory features are selected, I hyperparameter tune two gradient boosting methods, LightGBM and XGBoost regressors, and combine them to form an ensemble that performs stacked generalization, essentially using the “strength” of each estimator to average their outputs and compute the final estimate for each data point. Lastly, I use the hybrid model to generate predictions on the training data, which are then compared against the true target value to assess performance via R2 score, and the final model is deployed on the test set.
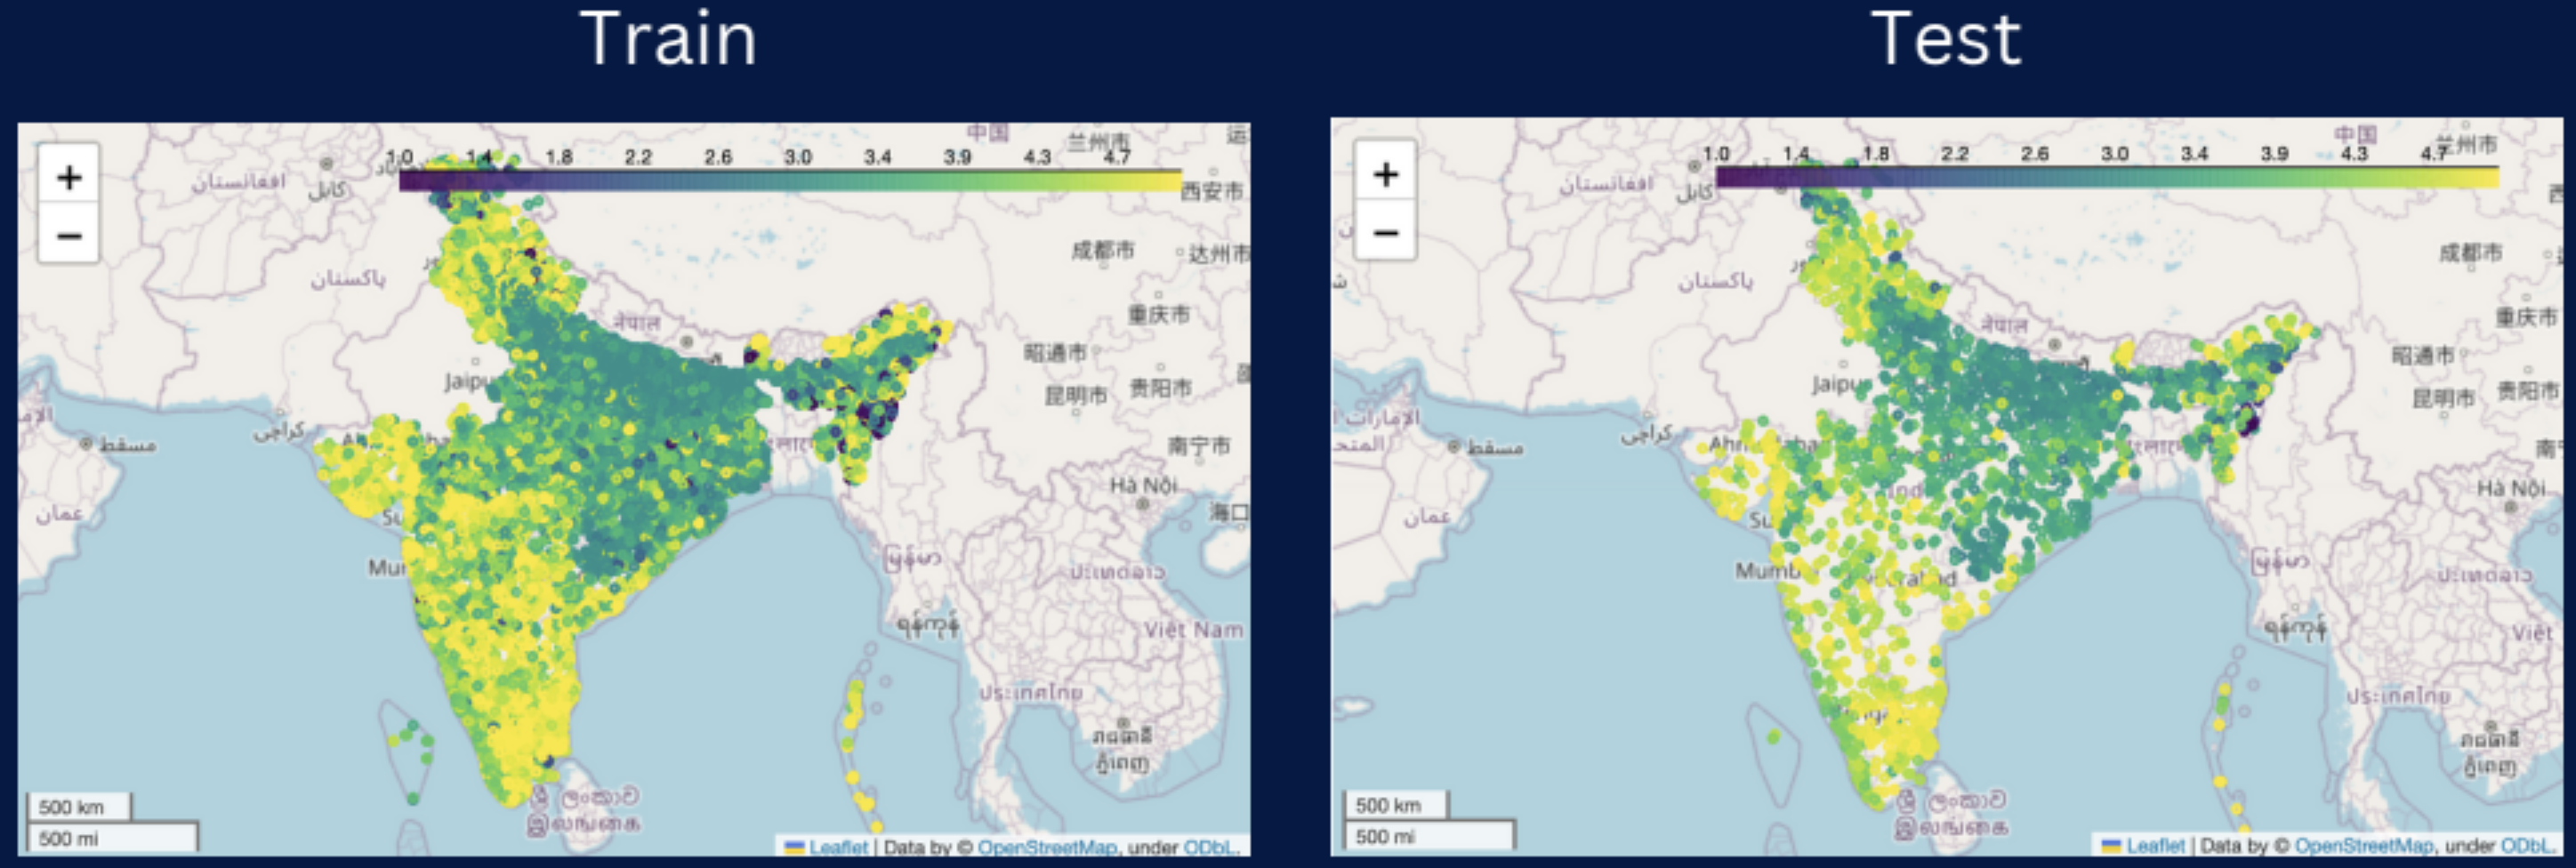
Validation
To ensure that model performance is as expected on unseen data, I partitioned the data prior to training to create a validation set, which returned a similar R2 score and thus reflects reasonable generalizability. Visually, we can confirm that the dispersion of test data points reflect similar spatial correlations to the training data as we see comparable clusters around the bounds and center of the map.
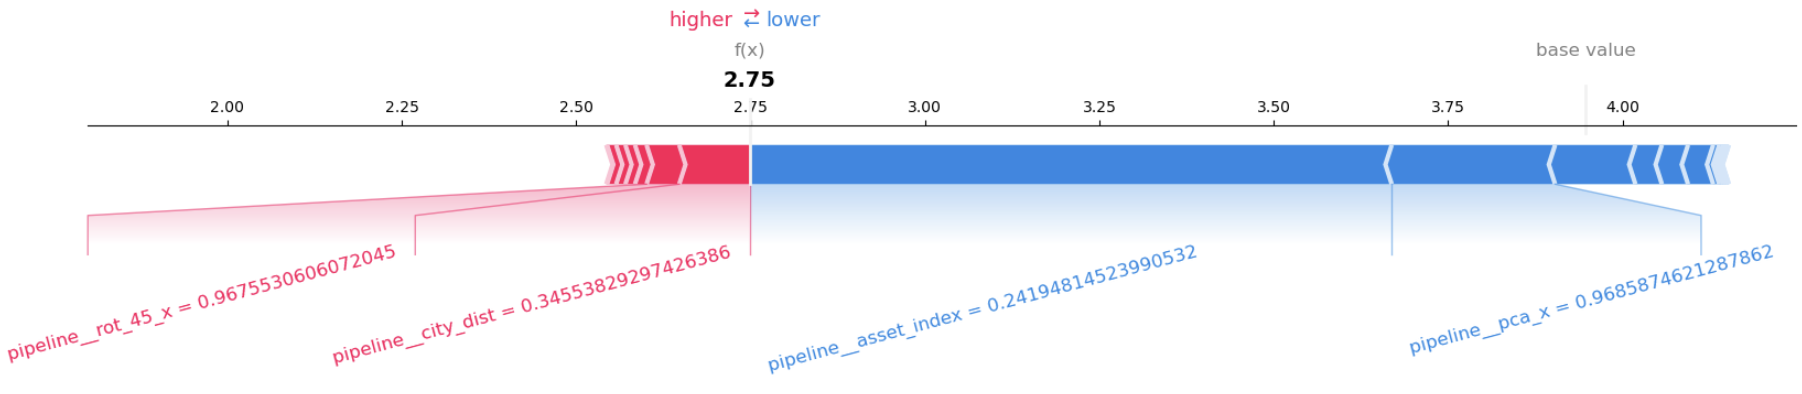
Gradient boosted frameworks also allow for the interpretation of different features using SHAP estimation, where we can see that households with a lower asset index had predictions with lower water quality index and vice versa, which is as expected Furthermore, I found that several other regression methods produced varying degrees of overfitting (gaps of around 0.10-0.20 between the training and validation data), thus providing justification for the inclusion of spatial interpolation in the pipeline.
Since this approach relies heavily on the latitude and longitude for geospatial projections, I must acknowledge that the random jittering applied to the coordinates to protect survey participant privacy will likely impact the precision of these estimates. Thus, to supplement the analysis, I would have liked to explore the satellite images to extract additional features. However, due to time constraints, I proposed this as a future outlook for the model.
References
C. Yeh, C. Meng, S. Wang, A. Driscoll, E. Rozi, P. Liu, J. Lee, M. Burke, D. Lobell, and S. Ermon, “SustainBench: Benchmarks for Monitoring the Sustainable Development Goals with Machine Learning,” in Thirty-fifth Conference on Neural Information Processing Systems, Datasets and Benchmarks Track (Round 2), Dec. 2021. [Online]. Available: https://openreview.net/forum?id=5HR3vCylqD.