Exploratory Analysis on Women in Data Science (2022)
Code Repository
Technique Overview
- Python
- altair
- pandas
- matplotlib
- Exploratory Data Analysis
- Statistics
- Data Visualization (Interactive)
Methods
The data set and source code that was used in the creation of this article can be found on this Github repository. Specifically, the visualizations (along with other iterations that didn’t make the cut) can be found in this Jupyter Notebook. All plots were configured using the declarative visualization library, Altair.
What is Kaggle and what is the Machine Learning and Data Science Survey?
Kaggle is an online platform that allows data enthusiasts to come together as a community and solve real world challenges. It provides users with a virtual cloud environment to train and test models, features a wide repository of datasets, hosts competitions across multiple domains, and can serve as an excellent resource for those interested in furthering their data science education.
Since 2017, Kaggle has released an annual industry-wide survey to collect information about the state of data science. Their goal is to construct a comprehensive view of the industry from data points such as what technologies are being used, what roles have been filled, and which methods are commonly applied. This data is collected and compared year-to-year in efforts to assess ongoing trends in data science.
While the team at Kaggle has performed their own EDA, this does not capture differences between men and women as distinct groups. Hence, I will be expanding on their work by examining survey results through the lens of gender.
Survey Demographics
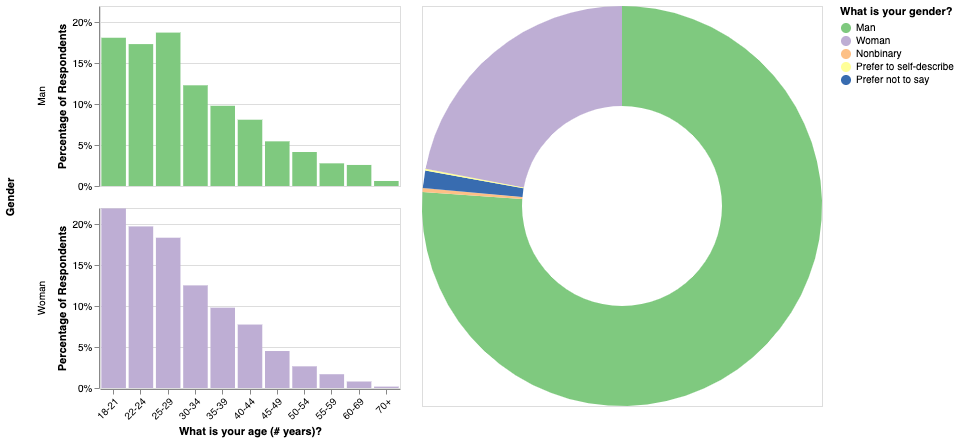
Figure 1: Age distributions for men vs. women and a donut chart representing the gender diversity of respondents. “Percentage of Respondents” is with respect to each gender.
In Figure 1, we see that less than 23% of survey respondents identified as a member of a gender minority and only 22.0% identified as women. There also seems to be larger proportion of young women between the ages of 18 and 24 on Kaggle compared to men in the same age range. From first glance alone, it is obvious that women are a minority in the community.
Disclaimer: for the sake of comparison, I have chosen to exclude surveyors who did not identify as either men or women beyond this point due to the low sample sizes shown above. I support that all gender minorities deserve to be represented in tech, though I have not visualized others here to avoid any figures being misconstrued.
International Reach
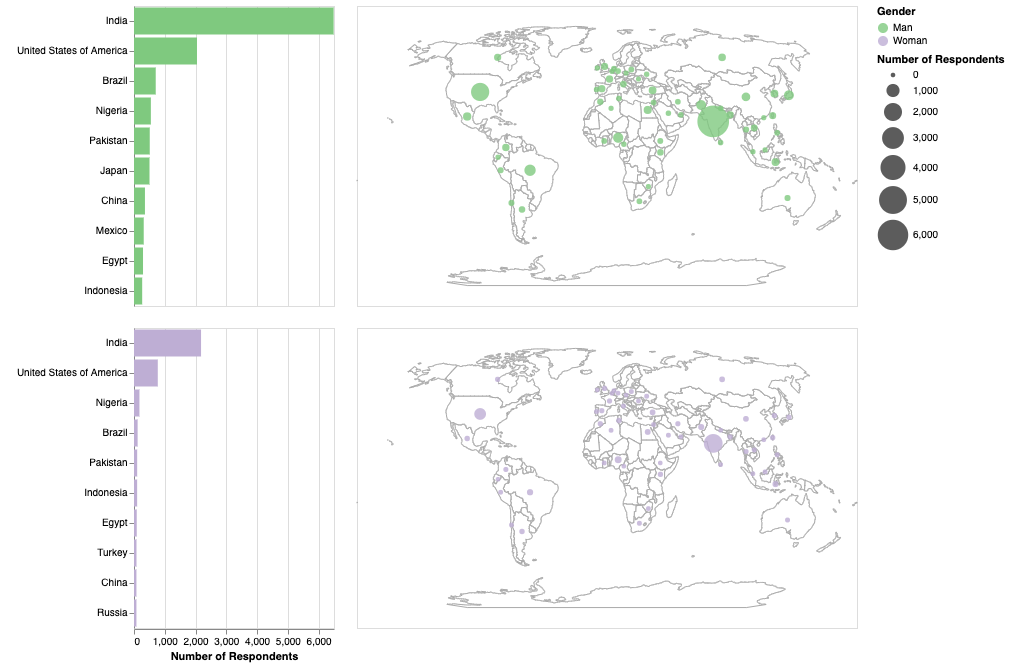
Figure 2. Top 10 countries for men and women by number of respondents, along with a map of all respective locations that were reported.
The majority of Kagglers currently reside in India, followed by the United States. We see that among the top 10 countries, there is not much variation in location by gender, however Turkey and Russia seem to have more female users than other nations. We can see that there is a fairly global interest in data science with individuals using Kaggle from around the world, which I only expect will continue to expand in the coming years.
Academic History
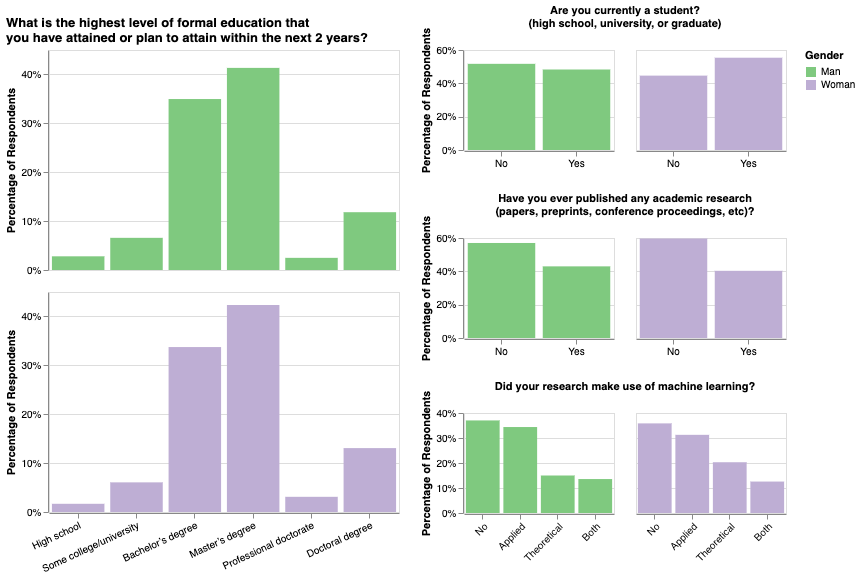
Figure 3. Education level distributions as well as research-affinity for men and women. Research involving the use of ML as a tool was considered ‘applied’ and research that aimed to advance a novel ML methods was considered ‘theoretical’. All percentages are with respect to each gender.
Above, we see that the relationships between education and gender have similar trends; most respondents have completed at least a bachelor’s degree, if not graduate studies. Interestingly, there are more women on Kaggle who are current students compared to men. This could be indicative of an increased interest in pursuing data science for women during their studies. Moreover, 20.3% of women whom have conducted research did so by advancing a novel ML method, which was higher than the relative proportion of men. It could be that women in academia show more enthusiasm towards the development of ML technologies, or perhaps that there have been fewer opportunities for women to solely apply ML techniques in their research, but there are too many confounds to tell.
Technical Experience
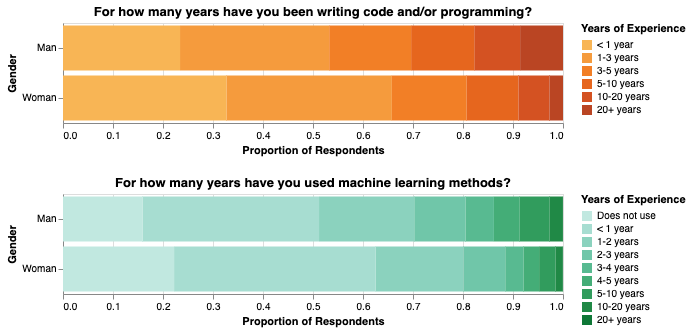
Figure 4. Normalized proportions of men and women by years of experience with programming and ML.
On average, male respondents were more experienced with programming and ML compared to females. Considering the relatively recent emergence of the field, it is not surprising to see that the many people are in the early stages of their ML journeys. Over 35% of women reported having used ML methods for more than one year, which is about 10% less than the equivalent metric for men.
Work Experience
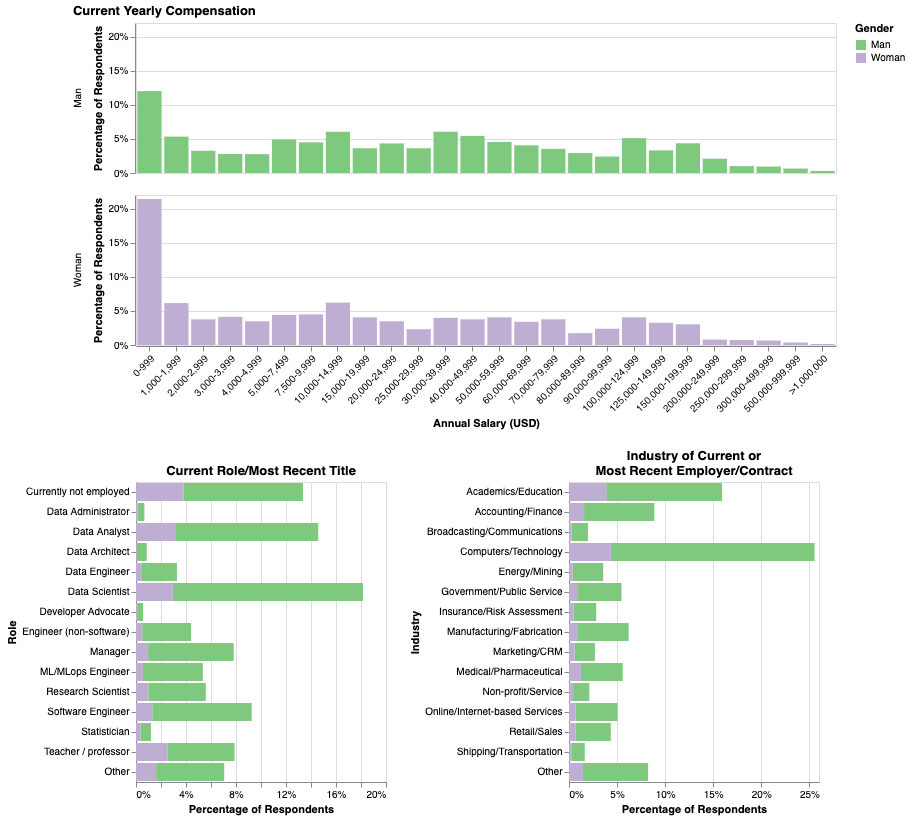
Figure 5. Annual compensation, title and industry distributions for men and women. In the compensation graph (top), be mindful that the salary ranges are not consistent ($90,000–99,999 to $100,000–124,999 for example).
Over 21% of women who completed the survey reported making less than $1,000 annually compared to about 12% of men. In addition, around 13% of women have a salary over $100,000 opposed to close to 18% of men. The scope of salaries does seem a bit alarming, with roughly 50% of both genders reporting making less than the average living wage for a single adult in the US, though we should keep in mind how the cost of living varies around the world and how many Kaggle users are also students.
Overall, the most popular roles were data analyst and data scientist. When normalized by role, women were more frequently statisticians and teachers/professors compared to other positions, while the highest proportions of men were data architects and engineers. There were no roles that had a majority of women (none even came close to 50%), thus highlighting a need for more female workers across all positions. Women were less likely to be a part of the energy/mining industry and more commonly found in the education, marketing and medical fields. One future direction would be to explore how titles and industries are influenced by age group and/or education level, i.e.:
- Is there a large proportion of older men being hired in data engineering roles compared to older women with similar backgrounds?
- Would having an advanced degree benefit women when it comes to placements in certain industries?
- What are the highest paying tech roles for women?
Summary and Final Thoughts
Using responses from Kaggle’s 2022 survey, I found that:
- Unsurprisingly, women are severely underrepresented coming in at 22.0% of Kaggle users.
- On a global scale, there are women in data science around the world, with Asian countries taking some of the top spots for most female Kagglers.
- 55.4% of women on Kaggle are currently students, which seems promising for the future of diversity in the tech roles!
- While most Kagglers are quite new to ML, it does seem that many individuals are curious about the field, with over 75% of women reporting having used ML methods before.
- Data scientists and analysts dominate the Kaggle community, but women only make up around 30% of them.
Overall, we still have a ways to go before we see a gender balance within data science. However, recognizing the disparities is what first highlights these areas for improvement. It has been suggested that the industry is going to experience an increase of 15% in jobs between 2019 and 2029, thus I have hope that more companies will see the value of diversity in their workforce and find more opportunities to invest in women.
If anything from this analysis, I encourage you to explore as many options as you are interested in within data science. The field is broad and there are endless opportunities to take part in this movement. While you may sometimes feel alone, understand that there will always be ways for you to contribute your skills and ideas. There is no simple solution to addressing the representation issue in tech, though as individuals, we can start by taking initiative in actively acknowledging our biases - both towards others and against ourselves. Consider everything as a learning experience. Avoid shying away a challenge just because it seems intimidating at first. Take risks and experiment outside of your comfort zone. Encourage those around you to do the same and eventually, the industry will shift.
Limitations
As I have not calculated nor reported any statistical results, I must caution readers about making inferential or general conclusions regarding my EDA. These findings are simply demonstrating the state of representation on Kaggle, which may be comparable to the overall industry, but cannot be truly generalized without conducting proper hypothesis tests (though I am open to exploring this).
Due to time constraints, I was unfortunately unable to analyze more comparisons across men and women in terms of common data science frameworks, preferred media sources and widely used machine learning and cloud computing products among others. I hope to eventually extend this analysis to incorporate these insights so that better strategies for recruiting and encouraging women to partake in data science may be developed.
References
2022 Kaggle Machine Learning & Data Science Survey. Retrieved January 22, 2023, from https://www.kaggle.com/competitions/kaggle-survey-2022
Alexander, H. (2022, December 22). Girls in data: Inspiring the future of female data science. Open Access Government. Retrieved January 22, 2023, from https://www.openaccessgovernment.org/girls-in-data-inspiring-the-future-of-female-data-science/142235/
Duranton, S., Erlebach, J., Brégé, C., Danziger, J., Gallego, A., & Pauly, M. (2022, August 9). What’s keeping women out of data science? BCG Global. Retrieved January 22, 2023, from https://www.bcg.com/publications/2020/what-keeps-women-out-data-science
Fran. (2021, March 24). Data science insights: Job and market growth statistics. FutureLearn. Retrieved January 22, 2023, from https://www.futurelearn.com/info/insights/data-science-insights
Hendriksen, S. P. E. (2015, May 27). What is impostor syndrome? Scientific American. Retrieved January 22, 2023, from https://www.scientificamerican.com/article/what-is-impostor-syndrome/
UBC girlCode. (n.d.). Retrieved January 22, 2023, from https://www.ubcgirlcode.com/
What a living wage is and why businesses should use it as a benchmark. JUST Capital. (n.d.). Retrieved January 22, 2023, from https://justcapital.com/reports/living-wage-guide-for-business-just-jobs-explained/