Predicting the Grade of Restaurants in New York City
Code Repository
Technique Overview
- Python
- sklearn (Logistic Regression)
- pandas
- matplotlib
- Exploratory Data Analysis
- Data Visualization
- Reproducibility
- Makefile
- Docker
- Github Pages
- Environment/Dependencies
- Project Management
- Milestones, Issues, Releases
- Code of Conduct, Contributing, License
- Documentation (Report Building, Automated Rendering)
Project Summary
In this project, we build a classification model using logistic regression and support vector machines which uses health inspection data to predict whether a restaurant will be graded A (i.e., the restaurant is clean, up to code, and free of violations.) or F (i.e., the restaurant has some issues that must be fixed or is a public risk on the verge of closure).
Our best model was a balanced logistic regressor with a C value of 0.024947, 1 numeric feature, 130 text features and 47 categorical features. On a test set of 10000 samples, we returned an F1 score of 0.975 and precision and recall scores of 0.999 and 0.999 respectively, indicating that our model is highly effective at classifying both grade A and F restaurants. We also computed the area under a receiver operating characteristic curve which was found to be 1.00. This is the optimum value which also supports that the predictions from our model are close to 100% correct.
We chose the data set, DOHMH New York City Restaurant Inspection Results sourced from NYC OpenData Portal. It is retrieved from the tidytuesday repository by Thomas Mock, and can be sourced here. The original data set can be found here. It contains the violation citations from every inspection conducted for restaurants in New York City from 2012 to 2018. Each row represents a restaurant that has been assessed by a health inspector, including information about their business such as the restaurant name, phone number, location and type of cuisine, as well as the details about their inspection. The restaurants can be assigned an official grade of A, B, or C, otherwise they are assigned Z or P for pending review.
Introduction
After the state proclaimed the restoration of indoor dining during the COVID 19 era, hundreds of new restaurants have opened throughout New York City (Eater NY, 2020). Now that things are getting back to normal as the restrictions set by government are lifted and people are returning back to dining out as the hotel sector reopens, the general safety of restaurants has taken on utmost importance in light of the current state of affairs of COVID. The standards that health inspectors use for grading will probably need to be revised because health rules have become more stringent in order to curb the pandemic. The overall plan used by health inspection is as follows, though it may vary by state:
- GRADE A: The restaurant is clean, up to code, and free of violations.
- GRADE B: The restaurant has some issues that must be fixed.
- GRADE C: The restaurant is a public risk and on verge of closure.
(Source: SmartSense, 2018)
As data scientists, we’re curious about how we can evaluate and predict a restaurant’s general level of quality so that we can provide recommendation on the right restaurants which can be dined in safely by classifying the restaurant as “good” or “poor” (in our case, Grade A vs.Grade B/C). As we have access to restaurant data for the New York City, we would like to concentrate our analysis on forecasting the grading of restaurants as Good or Poor for specific NYC locations, with plans to eventually expand to other metropolitan regions. We believe that our efforts could be useful for the residents or tourists in NYC and this could be a one-stop solution for people who are looking to dine in without having to worry about quality.
Research Questions
Can we predict the grade for a restaurant (Grade A or F) given different metrics describing their health violations during a routine inspection?
Besides this main research question, our analysis would also like to address some interesting sub-questions given below:
- Which cuisines are more likely to be graded A in NYC?
- Which cuisines are more likely to be graded B or C in NYC?
- Which borough in NYC seems to have the best restaurants?
- Which borough in NYC seems to have the most restaurants with the most severe violations?
- What words in a violation description contribute most to whether a restaurant is graded A or B/C?
Data
The data set that we are using in our analysis for the restaurant grading, DOHMH New York City Restaurant Inspection Results, is sourced from NYC OpenData Portal. It was obtained from the tidytuesday repository by Thomas Mock (2022). The original data set can be found here.
Summary
The data includes all of the violation citation from the restaurant inspections held in New York City from 2012 to 2018. Each row represents a restaurant that has undergone a health inspection which has the information about each establishment including the restaurant name, phone number, location (borough, building number, street, zip code), cuisine type, and also the details about the inspection itself which includes date, violation code, description, whether there were any violations cited, whether they were critical, etc. The restaurants may receive an official grading of A, B, or C; alternatively, they may receive a Z or P for an evaluation that is still pending. A complete dictionary of the data can be found here.
Exploratory Data Analysis
We performed the exploratory data analysis on the restaurant dataset and we noticed that the total strength of inspections were 3,00,000, out of which only 151,451 had a value filled in for the grade column that we are interested in.
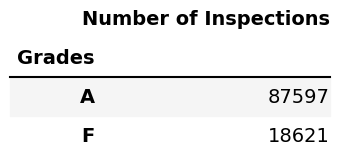
Table 1.1 Counts of inspections in the training data by class.